
The Rent. 2020 National Apartment Average Rent Price Analysis tracks trends and changes in lease pricing around the country over the course of the last year.
We have analyzed and summarized the report here to showcase interesting and useful insights including variations by state and city, the cost comparison of adding additional bedrooms, which places are most representative of the nation as a whole, which cities experienced the greatest fluctuations in year-to-year rent changes and more. This analysis will assist renters as they consider moves to different parts of the nation.
Additionally, this year we have added some statistics about rent price changes due to the coronavirus crisis and the succeeding economic crisis between the months of March and June, nationally, on a state-by-state basis and on the city level for some of the hardest-hit regions of the country.
In this analysis:
- National average rent prices
- Average rent prices by state
- Rent prices by city
- States and cities vs. national average
- Rent price trends by adding additional bedrooms
- March to June rent changes in COVID hotspot states
- March to June rent changes in COVID hotspot cities
- Methodology
National average rent prices for each apartment room type
Overall, the price of an average bedroom across the country as of Q2 2020 runs from an average of just less than $1,690 for a studio apartment to upwards of $2,017 for a large three-bedroom unit. Going against prevailing tides, nationally on average, one-bedroom apartments were less expensive than studios.
Average national rent prices in 2020, 2019 and 2018
In comparison to the same time last year, the average lease price for every apartment type — from studio up to three-bedroom — increased, with studio apartments showing the largest increase at 5.37 percent year-to-year followed by two-bedroom units, up nearly 4.5 percent and more than $62 from last year. Meanwhile, one-bedroom apartments increased just a slight 1.6 percent on average since 2019.
Due to economic variables, as well as the coronavirus crisis, the increase in rents from 2019 to 2020 was mostly higher than the increases from 2018 to 2019. Lease rates for studio apartments, for example, fell by more than $70 from 2018 to 2019 before rising more than $86 from last year to this (a two-year swing of $158), and the price of a two-bedroom was down a quarter of a percent two years ago to last year then proceeded to increase from 2019 to 2020 by nearly 5.5 percent.
And in a longer picture, prices increased significantly for all apartment types over the two years from 2018 to today, with a more than $50 per month rise in average lease prices for one, two and three-bedroom units.
| Bedrooms | Average Rent | YoY % Change | Yo2Y % Change |
|---|---|---|---|
| Studio | $1,691 | 5.4% | 0.8% |
| 1 | $1,621 | 1.6% | 3.2% |
| 2 | $1,878 | 3.5% | 3.2% |
| 3 | $2,017 | 2.4% | 2.6% |
Average national rent prices from March 2020 to June 2020 during the coronavirus pandemic
Of course, 2020 is a different animal than any previous year due to the coronavirus pandemic and the economic crisis that followed, causing job losses and a mass rent payment disaster. As both landlords and tenants struggled to mitigate the crisis’ impact, rents fluctuated accordingly.
Between the start of the pandemic’s impact in March to the current totals in June, every apartment size type saw at least a 1 percent increase in average rent every month (with one exception), with the greatest month-to-month increases happening between March and April or April and May as the rents came due for the majority of those who were laid off or furloughed.
The largest increase came for those in two-bedroom apartments between March and April, indicating housing struggles for small families or tenants with roommates in lower-to-middle income careers who were impacted early on. Those same difficulties can be seen in overall increases from March through June, as rents for two-bedroom units rose nearly 7 percent and up $131 total in just four months.
| Bedroom | Month | Average Rent | MoM % Change |
|---|---|---|---|
| Studio | March | $1,624 | N/A |
| Studio | April | $1,664 | 2.5% |
| Studio | May | $1,694 | 1.8% |
| Studio | June | $1,716 | 1.3% |
| 1 | March | $1,560 | N/A |
| 1 | April | $1,592 | 2.1% |
| 1 | May | $1,626 | 2.1% |
| 1 | June | $1,651 | 1.5% |
| 2 | March | $1,786 | N/A |
| 2 | April | $1,842 | 3.1% |
| 2 | May | $1,881 | 2.1% |
| 2 | June | $1,917 | 1.9% |
| 3 | March | $1,995 | N/A |
| 3 | April | $1,987 | -0.4% |
| 3 | May | $2,039 | 2.6% |
| 3 | June | $2,029 | -0.5% |
Average national rent price differences during the 2020 coronavirus pandemic compared to previous years
So, how much did the coronavirus crisis really affect rent price increases? While there was clearly a month-to-month increase in 2020 from March through June, what do previous years show?
Compared to 2019, it does seem as if the pandemic and its related economic emergency had an effect. For example, while studio apartment rents rose more than $90 during those months in 2020, they were nearly flat in the year prior. As well, while leases for a two-bedroom in 2020 increased by nearly 7 percent, the rise was just more than 2 percent during the same period in 2019.
However, when taking a step back and comparing 2018 to 2020, there are very similar month-to-month increases. All apartment types rose a nearly identical percentage in 2018 and 2020, all four within 2 percentage points. For example, the rise in one-bedroom prices this year and two years ago were just 56¢ apart and studios were separated by just 0.06 percent.
The takeaway is that while the pandemic and the employment crisis were factors in rent increases from the start to now, economic factors in any year can affect lease pricing just as much when taken in a national snapshot.
| Bedrooms | Time Range | Average Rent Price Change | Average Rent Price % Change |
|---|---|---|---|
| Studio | March 2020 to June 2020 | $91.0 | 5.3% |
| Studio | March 2019 to June 2019 | $0 | 0.0% |
| Studio | March 2018 to June 2018 | $89.0 | 5.4% |
| 1 | March 2020 to June 2020 | $91.0 | 5.5% |
| 1 | March 2019 to June 2019 | $44.0 | 2.7% |
| 1 | March 2018 to June 2018 | $92.0 | 5.8% |
| 2 | March 2020 to June 2020 | $131.0 | 6.8% |
| 2 | March 2019 to June 2019 | $37.0 | 2.0% |
| 2 | March 2018 to June 2018 | $89.0 | 4.9% |
| 3 | March 2020 to June 2020 | $74.0 | 3.6% |
| 3 | March 2019 to June 2019 | $34.0 | 1.7% |
| 3 | March 2018 to June 2018 | $73.0 | 3.7% |
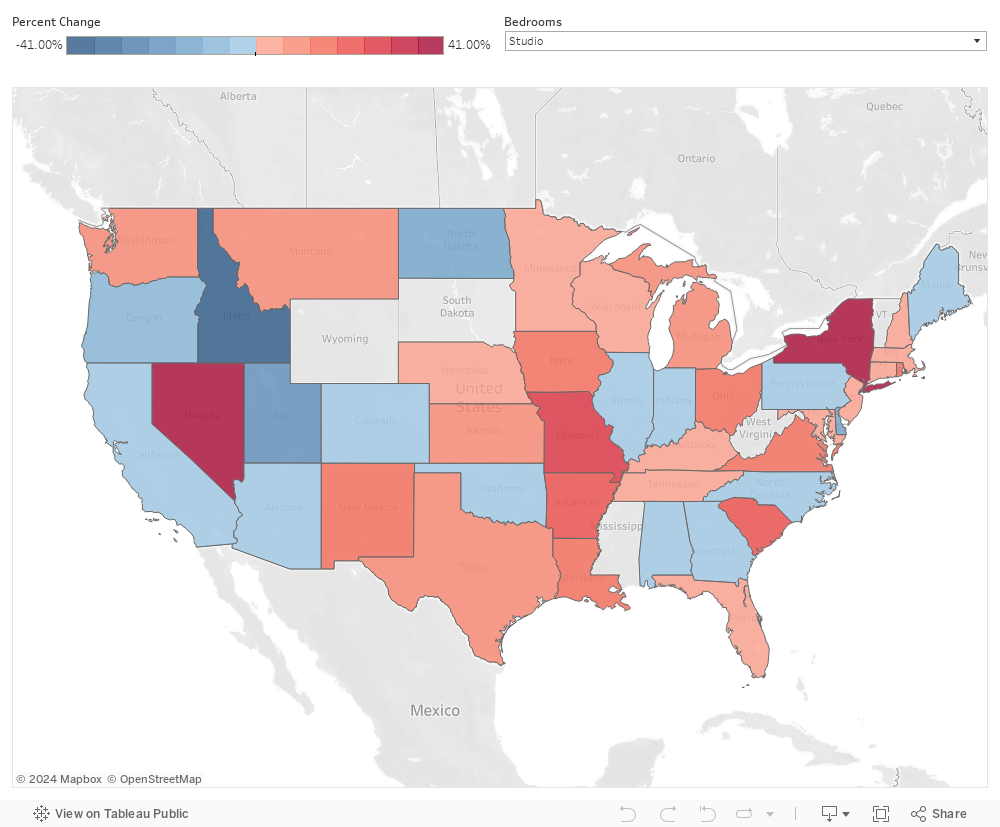
Average rent prices by state
When evaluating the average rent prices by state, we noticed some interesting trends around which parts of the country experienced the greatest increases and decreases. In short, the most or least expensive areas did not always translate to the largest rent increases or decreases.
The most expensive states in 2020
Overall, in 2020, which are the most expensive states in which to rent? As expected, they are coastal states with large metropolises and high population density. But if you guessed New York, you would be mostly incorrect.
In fact, the most expensive states in the U.S. are Massachusetts and California, along with the District of Columbia. The designation makes sense. D.C. and those states indeed feature large and crowded population centers with high costs of living, as well as large percentages of wealthy Americans and high-end rentals, along with the large companies and high paying jobs to sustain the pricing. And spots like Boston, Washington, Los Angeles and San Francisco are high-demand places to live.
Massachusetts, with its 350,000 college students ranks as the most expensive city for studio apartments, above even New York and its Manhattan towers, and ranks in the top three in the other categories, as well. But for one- and two-bedroom apartments, Washington, D.C. and its political staffers, lobbyists and nearly half a million government employees — many from out-of-state and booking up every available rental — comes out on top.
And while prices in the most expensive states are up year-to-year from 2019 and back to 2018, the same states, in some order, occupy the top spots consistently through any economy.
So, why not New York? While of course New York is high up in the rankings, compared to the multiple megalopolis centers of California, the size of Boston to the rest of the state and D.C.’s compactness, New York State is a one-trick pony. Sixty percent of New York State residents live outside of New York City, and 35 percent live away from the N.Y.C. region entirely. Those less expensive areas from the Adirondacks to Buffalo bring the state averages down.
The least expensive states in 2020
On the other end, which states have the cheapest overall rents? As expected, states in the South and out on the Plains in wide-open spaces with older populations, minimal density and lower incomes. The demand for rental housing in these states without large population centers is lower, and more people live in less crowded counties and in rural areas.
Overall, the cheapest state in which to rent is Arkansas, which has both the lowest average rates for both studio apartments and two-bedroom units, with Oklahoma entering the top three in all three-bedroom categories. But for one-bedroom apartments, Alaska is the last frontier for cheap rents despite its higher cost of living attributed to more expensive goods so geographically removed from the supply chain of the continental U.S.
Between last year and this year, average rental rates for studio apartments has increased significantly. Mississippi sat at the top spot in both 2018 and 2019 with rents less than $500, but as unit availability dropped significantly in a handful of states in 2020, the average rate for the lowest available studios increased. Rates for one- and two-bedrooms in the cheapest states stayed fairly consistent from 2019 to 2020 after falling between the prior years.
The largest states in 2020
As expected, California and New York, the No. 1 and No. 4 most populated states, are also among the most expensive. Texas, with its five metropolises but a lot of smaller cities, towns and rural counties, and Pennsylvania and its lower cost of living compared to many of its northeast corridor neighbors, remain overall rather affordable. Both Texas and Florida average higher rents for studio apartments than the one-bedroom units.
California, for all its size and expense, has remained fairly consistent in price over the last two years. The price of studio apartment rent has risen just $34 a month and one-bedrooms just under four bucks. Both Texas and Florida have stayed evenly priced for all apartment types year-to-year, as well, while New York, the coronavirus first wave epicenter, has fluctuated significantly since 2018. Meanwhile, Pennsylvania can lay claim as the most increasingly affordable among the most populated states as rental prices in all categories have continued to fall each year since 2018.
Full data on average rent by state
| State | Studio Average Rent | 1BR Average Rent | 2BR Average Rent |
|---|---|---|---|
| AK | $1,065.00 | $679.74 | $1,266.60 |
| AL | $700.48 | $946.94 | $1,060.12 |
| AR | $667.16 | $759.03 | $856.43 |
| AZ | $1,037.02 | $1,317.31 | $1,613.10 |
| CA | $2,403.94 | $2,559.61 | $3,175.54 |
| CO | $1,594.65 | $1,795.87 | $2,154.84 |
| CT | $1,387.09 | $1,642.01 | $2,036.84 |
| DC | $2,020.33 | $2,729.08 | $3,574.72 |
| DE | $1,106.56 | $1,255.80 | $1,442.02 |
| FL | $1,665.98 | $1,629.97 | $1,853.80 |
| GA | $1,458.42 | $1,351.87 | $1,614.23 |
| HI | $1,809.75 | $1,795.91 | $2,153.46 |
| IA | $901.83 | $920.27 | $962.16 |
| ID | $950.79 | $1,137.25 | $1,189.15 |
| IL | $1,746.87 | $1,949.91 | $2,357.50 |
| IN | $1,029.82 | $1,055.94 | $1,243.15 |
| KS | $1,144.10 | $1,030.91 | $1,075.80 |
| KY | $910.53 | $1,064.94 | $1,234.36 |
| LA | $1,124.50 | $1,065.35 | $1,135.63 |
| MA | $2,476.12 | $2,644.07 | $3,120.45 |
| MD | $1,527.12 | $1,675.44 | $1,869.39 |
| ME | $1,341.76 | $1,375.47 | $1,607.84 |
| MI | $1,150.31 | $1,128.91 | $1,322.48 |
| MN | $1,261.37 | $1,376.11 | $1,667.98 |
| MO | $1,079.25 | $1,490.26 | $1,594.53 |
| MS | N/A | $808.18 | $886.73 |
| MT | $996.50 | $1,145.93 | $1,287.50 |
| NC | $1,237.51 | $1,151.17 | $1,312.78 |
| ND | $689.67 | $871.47 | $982.45 |
| NE | $821.34 | $1,001.97 | $1,207.59 |
| NH | $1,191.42 | $1,631.61 | $1,824.32 |
| NJ | $2,008.04 | $2,038.41 | $2,558.25 |
| NM | $697.28 | $967.75 | $1,191.74 |
| NV | $938.46 | $1,231.97 | $1,486.98 |
| NY | $2,431.44 | $2,476.63 | $2,637.84 |
| OH | $997.61 | $1,109.14 | $1,365.99 |
| OK | $681.36 | $712.82 | $904.55 |
| OR | $1,417.74 | $1,706.40 | $2,053.63 |
| PA | $1,371.91 | $1,640.09 | $2,018.79 |
| RI | $1,555.42 | $1,893.35 | $2,427.56 |
| SC | $1,379.68 | $1,211.75 | $1,393.05 |
| SD | N/A | $727.40 | $893.39 |
| TN | $1,266.20 | $1,337.32 | $1,510.48 |
| TX | $1,334.93 | $1,271.46 | $1,576.46 |
| UT | $1,155.07 | $1,267.42 | $1,499.36 |
| VA | $1,835.89 | $1,793.27 | $2,092.80 |
| VT | N/A | $1,485.71 | $1,388.14 |
| WA | $1,791.66 | $2,155.07 | $2,237.66 |
| WI | $1,171.37 | $1,205.10 | $1,531.86 |
| WV | $0.00 | $1,170.67 | $1,227.53 |
| WY | N/A | $697.53 | $884.47 |
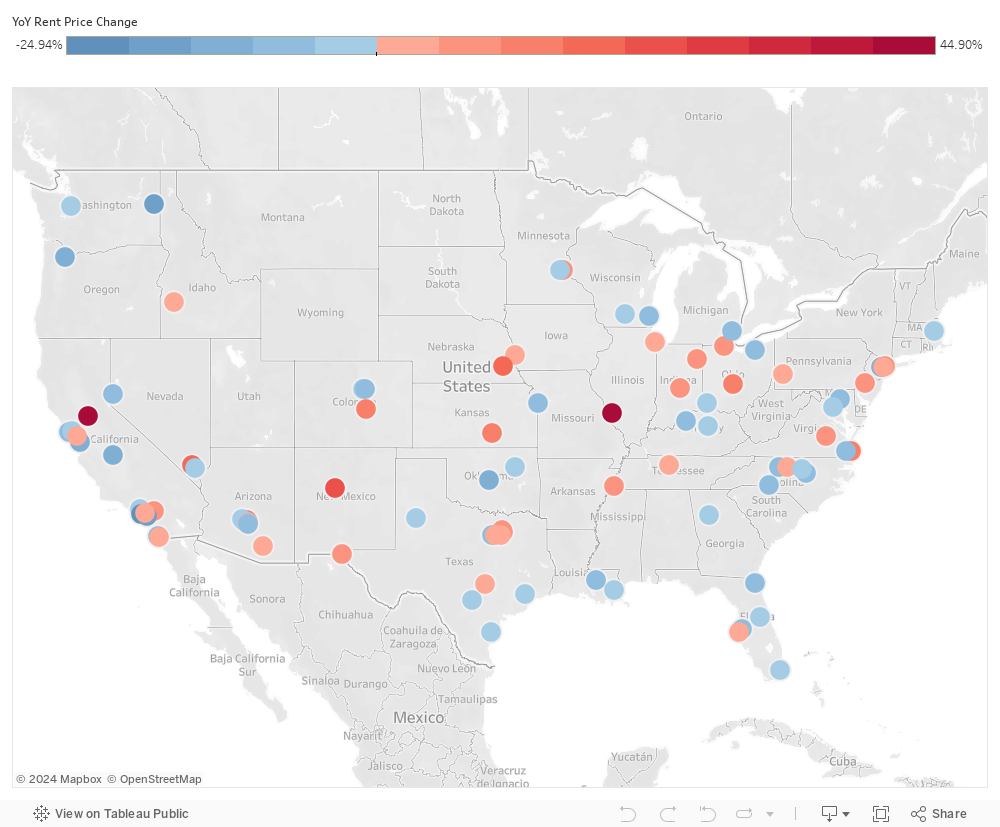
Average rent prices by city
Narrowing down the focus even further, we find vast differences in the range of rent prices by markets in the U.S., especially when looking at the 100 largest cities by population.
The most expensive U.S. cities in 2020
It isn’t a great leap to figure the priciest cities would be in the priciest states, along the coasts and in high cost-of-living regions. But in the past where mega-sized cities like New York and San Francisco led the charts, it’s some smaller resort cities and bedroom communities where business leaders and the affluent reside that are at the top.
At the top of the list for studio apartments is Playa Vista, CA. The small but upscale region of Los Angeles is the only city where studio rents average above $4,000. Its appealing location near the beach, the airport and entertainment districts keep it in high demand, topping the list for the second consecutive year.
Two Boston area municipalities, Charlestown and Allston, come in just below. The cities with the most expensive one- and two-bedroom apartments are familiar upscale communities with chic reputations in disparate corners of America, Palm Beach, FL; Santa Monica, CA and Port Chester, NY.
| Bedrooms | City | Average Rent |
|---|---|---|
| Studio | Playa Vista, CA | $4,316 |
| Studio | Charlestown, MA | $3,662 |
| Studio | Allston, MA | $3,424 |
| 1 | Palm Beach, FL | $5,625 |
| 1 | Port Chester, NY | $4,748 |
| 1 | Santa Monica, CA | $4,682 |
| 2 | Santa Monica, CA | $7,519 |
| 2 | Woodbury, NY | $5,821 |
| 2 | West Hollywood, CA | $5,684 |
The largest U.S. cities in 2020
The population does not play as much of a role in apartment expense as location. America’s two largest cities, New York and L.A. sit on each coast and offer some rather outrageous average rental prices considering their economic diversity and wide-ranging neighborhood styles from dense city centers to suburban-style residential regions.
But the nation’s third, fourth and fifth largest cities Chicago, Houston and Phoenix, all within the interior, one in the Great Lakes, one on the Gulf Coast and one in the desert Southwest, are much more affordable than their coastal counterparts. Prices remain steady at or lower than national averages despite offering as much commerce, employment, nightlife and family entertainment as N.Y.C. or L.A.
The good news is that consistently, rents in America’s biggest cities are trending down. Across the board in studios, one- and two-bedrooms, rent prices are lower than they were in 2019 for the five more populous cities. And when expanding the list to look at some of America’s other largest cities like Philadelphia, San Antonio, San Diego, Boston and Washington, D.C., the less expensive trend is consistently the same with few exceptions. In fact, in most categories, rents overall in the nation’s biggest cities are running a two year cheaper trend from 2018 to now.
| Rank by Population | City | Population | Studio Average Rent | 1-Year Change: Studio | 1BR Average Rent | 1-Year Change: 1BR | 2BR Average Rent | 1-Year Change: 2BR |
|---|---|---|---|---|---|---|---|---|
| 1 | New York, NY | 8,398,748 | $3,300.25 | -0.12% | $4,434.49 | 9.14% | $5,622.72 | -6.02% |
| 2 | Los Angeles, CA | 3,990,456 | $2,456.41 | -7.92% | $3,167.72 | -4.75% | $4,596.28 | -9.17% |
| 3 | Chicago, IL | 2,705,994 | $1,795.05 | -6.61% | $2,424.47 | 1.74% | $3,191.90 | -5.32% |
| 4 | Houston, TX | 2,325,502 | $1,186.34 | -20.53% | $1,235.68 | -3.54% | $1,615.94 | -4.55% |
| 5 | Phoenix, AZ | 1,660,272 | $1,075.30 | -18.06% | $1,393.79 | -3.89% | $1,780.23 | 8.39% |
| 6 | Philadelphia, PA | 1,584,138 | $1,604.57 | -0.96% | $2,116.70 | 5.01% | $2,918.73 | 3.52% |
| 7 | San Antonio, TX | 1,532,233 | $804.25 | -33.33% | $1,128.50 | -0.26% | $1,378.70 | -3.01% |
| 8 | San Diego, CA | 1,425,976 | $1,998.50 | -13.18% | $2,335.27 | -7.56% | $2,932.98 | -11.85% |
| 9 | Dallas, TX | 1,345,047 | $1,429.66 | 1.87% | $1,589.42 | 3.84% | $2,278.53 | 12.21% |
| 10 | San Jose, CA | 1,030,119 | $2,409.52 | -11.55% | $2,863.85 | -10.54% | $3,456.45 | -7.41% |
| 11 | Austin, TX | 964,254 | $1,289.36 | 4.53% | $1,511.21 | 3.98% | $1,737.98 | -7.55% |
| 12 | Jacksonville, FL | 903,889 | $723.08 | -14.39% | $1,097.24 | -6.30% | $1,294.53 | -5.93% |
| 13 | Fort Worth, TX | 895,008 | $1,353.65 | 4.90% | $1,289.02 | -5.81% | $1,570.22 | -7.49% |
| 14 | Columbus, OH | 892,533 | $1,138.40 | 22.96% | $1,130.43 | 12.84% | $1,346.15 | 13.95% |
| 15 | San Francisco, CA | 883,305 | $3,408.63 | -16.56% | $3,899.85 | -8.86% | $5,158.25 | -10.22% |
| 16 | Charlotte, NC | 872,498 | $1,368.73 | 2.89% | $1,322.65 | -5.83% | $1,596.86 | -4.75% |
| 17 | Indianapolis, IN | 867,125 | $1,035.76 | -5.92% | $1,131.60 | 8.96% | $1,407.20 | 16.97% |
| 18 | Seattle, WA | 744,955 | $1,732.67 | 7.90% | $2,495.28 | -3.06% | $3,996.71 | -3.73% |
| 19 | Denver, CO | 716,492 | $1,599.01 | -8.70% | $1,925.55 | -3.58% | $2,532.71 | -11.70% |
| 20 | Washington, DC | 702,455 | $2,020.33 | -6.68% | $2,729.08 | -1.17% | $3,574.72 | -4.52% |
| 21 | Boston, MA | 694,583 | $2,950.18 | -6.31% | $3,818.74 | -1.35% | $5,473.59 | -4.91% |
| 22 | El Paso, TX | 682,669 | $644.91 | 14.45% | $892.46 | 5.91% | $1,050.11 | 6.12% |
| 23 | Detroit, MI | 672,662 | N/A | N/A | $1,494.56 | -9.55% | $1,720.47 | -14.36% |
| 24 | Nashville, TN | 669,053 | $1,880.35 | 16.81% | $1,779.33 | 0.75% | $2,243.33 | -0.49% |
| 25 | Portland, OR | 653,115 | $1,432.66 | -6.15% | $1,803.48 | -12.50% | $2,379.98 | -8.16% |
Trends among states and cities vs. national averages
Now that we’ve analyzed the most expensive states and cities, what about the areas that are closest to the national average?
States closest to the national average
We know the most expensive states are the usual suspects in the Northeast and along the Pacific Coast and the least expensive are in the South and on the Plains. But what are the most representative states? Where can you find rents closest to the national average?
For each apartment size type, the states closest to the national average rent are all on the East Coast, but a bit away from the largest population centers. Both studio apartments and one-bedrooms in Florida are closest to the average, within just about $25 at $1,666 for studios and within nine bucks for one-bedroom units at $1,630.
For two- and three-bedrooms, the most average rates are in Maryland and Maine. Both are within commuting and entertainment distance of more pricey places like Massachusetts and D.C., keeping prices tampered.
Taking one-bedroom apartments as an average apartment size type, if you expand out the parameters to see the other states within about fifty bucks of the average, you see the same trends. The States closest to average lie along the East Coast near the expensive locations like New York, Massachusetts and D.C., but in states far enough away to bring prices down.
| Bedroom | State | Average Rent | Difference |
|---|---|---|---|
| 1 | National | $1,621 | N/A |
| 1 | FL | $1,630 | $9 |
| 1 | NH | $1,632 | $11 |
| 1 | PA | $1,640 | $19 |
| 1 | CT | $1,642 | $21 |
| 1 | MD | $1,675 | $54 |
U.S. cities closest to the national average
Differently but similarly, the cities closest to the national average for each apartment size follow comparable patterns. Each of the most average cities are bedroom communities for commuters within a distance of not just one, but two major, pricey cities. They’re far enough away for rents to stay low, but close enough to keep prices relatively active. The middle ground becomes an average lease rate.
The most average for studio apartments, just 16 cents difference, is Gaithersburg, MD, between Washington and Baltimore. Similarly — all within half a buck or so — each of the cities of other apartment types follows the same pattern, with Murrieta, CA, between L.A. and San Diego, Edmonds, WA, midway from Seattle to Everett and Lawrenceville in Central Jersey close to New York and Philadelphia.
Utilizing one-bedrooms as a typical apartment type, some of the same patterns emerge. All of the cities within about a buck-forty of the national average — six in all — sit in suburban lands near larger cities, giving them the convenience to high-rent cities with a distance that brings the rate down to average. These include Kinnelon, NJ, northwest of New York City, Cherry Hill, NJ, separated from Philadelphia by the Delaware River and Frisco, TX, a large satellite city of Dallas and Fort Worth.
| Bedroom | City | Average Rent | Difference |
|---|---|---|---|
| 1 | National | $1,621 | N/A |
| 1 | Tacoma, WA | $1,620 | $-1 |
| 1 | Kinnelon, NJ | $1,620 | $-1 |
| 1 | Frisco, TX | $1,621 | $0 |
| 1 | Murrieta, CA | $1,622 | $1 |
| 1 | Cherry Hill, NJ | $1,622 | $1 |
| 1 | Castle Rock, CO | $1,622 | $1 |
Rent price trends by adding additional bedrooms
Rental trends aren’t all about moving from city to city, region to region. As an individual renter’s needs change — significant others move in, families expand, a home office is needed — many look to upgrade from a studio to a one-bedroom to a two. How much more would it cost you to add a bedroom?
Change in national average rent per each room added
Nationally, there was actually an average decrease in rent prices when upgrading from a studio apartment to a one-bedroom. An average one-bedroom comes in more than 4 percent and around $70 lower than the average studio. This discrepancy can be attributed to factors like an increase in the availability of high-end luxury studio apartments, an increase in new construction of buildings and complexes with fresh and modern studios or, conversely, more one-bedroom vacancies due to the construction of more one-bedroom units.
That drop from studios to one-bedrooms is partly to blame for a steep rise from one-bedrooms to two, nearly 16 percent and more than $250 higher. The move to a larger three-bedroom will cost you another $140 a month on average, an increase of nearly 7.5 percent.
| Bedrooms | Average Rent | Rent % Change From Smaller Size |
|---|---|---|
| Studio | $1,691 | N/A |
| 1 | $1,621 | -4.1% |
| 2 | $1,878 | 15.9% |
| 3 | $2,017 | 7.4% |
Change in statewide average rent per each room added
On a state by state level, most of the nation saw expected changes in rental pricing for single-bedroom additions close to the national averages, including many states where studio apartments were also more expensive than one-bedroom upgrades. But there were several states with statistics that were outliers, as well.
There were a number of states that saw size-to-size increases more than 40 percent, a very steep jump for an upgrade. The usual factors, including demand and new construction, pushed rents to significant surges. The winner by far is Alaska, where the cost to move on up from a one-bedroom to a second bedroom rose more than 80 percent, by far the biggest increase. In a bad sign for growing families in Arkansas, California and Illinois, rent increases from a two-bedroom to a third were all between 40 and 50 percent in those states, as well.
In pure dollar figures, two states had monthly rent size increases of more than a thousand dollars. In California, an upgrade from a two-bedroom unit to a three will cost you a whopping extra $1,286 a month. The same move in Illinois will put you back an additional $1,062 and up $932 in Massachusetts. Moving from a one-bedroom to a two will run you over $500 more in Alaska, California, New Jersey and Rhode Island. And best of luck upgrading in D.C. where every single upward move costs more than $600 monthly each.
| State | Studio to 1BR Price Change | 1BR to 2BR Price Change | 2BR to 3BR Price Chanage |
|---|---|---|---|
| AK | -$385 | $587 | $387 |
| AL | $246 | $113 | $175 |
| AR | $92 | $97 | $473 |
| AZ | $280 | $296 | $450 |
| CA | $156 | $616 | $1,287 |
| CO | $201 | $359 | $666 |
| CT | $255 | $395 | $575 |
| DC | $709 | $846 | $674 |
| DE | $149 | $186 | $235 |
| FL | -$36 | $224 | $331 |
| GA | -$107 | $262 | $256 |
| HI | -$14 | $358 | $239 |
| IA | $18 | $42 | $116 |
| ID | $186 | $52 | $217 |
| IL | $203 | $408 | $1,062 |
| IN | $26 | $187 | $192 |
| KS | -$113 | $45 | -$389 |
| KY | $154 | $169 | $224 |
| LA | -$59 | $70 | $32 |
| MA | $168 | $476 | $932 |
| MD | $148 | $194 | $219 |
| ME | $34 | $232 | $407 |
| MI | -$21 | $194 | $31 |
| MN | $115 | $292 | $174 |
| MO | $411 | $104 | $478 |
| MS | N/A | $79 | $173 |
| MT | $149 | $142 | $162 |
| NC | -$86 | $162 | $49 |
| ND | $182 | $111 | $280 |
| NE | $181 | $206 | $99 |
| NH | $440 | $193 | $454 |
| NJ | $30 | $520 | $877 |
| NM | $270 | $224 | $282 |
| NV | $294 | $255 | $176 |
| NY | $45 | $161 | $296 |
| OH | $112 | $257 | $157 |
| OK | $31 | $192 | $161 |
| OR | $289 | $347 | $252 |
| PA | $268 | $379 | $19 |
| RI | $338 | $534 | $656 |
| SC | -$168 | $181 | $114 |
| SD | N/A | $166 | $95 |
| TN | $71 | $173 | $426 |
| TX | -$63 | $305 | $172 |
| UT | $112 | $232 | $98 |
| VA | -$43 | $300 | $77 |
| VT | N/A | -$98 | N/A |
| WA | $363 | $83 | $49 |
| WI | $34 | $327 | $128 |
| WV | $1,171 | $57 | $82 |
| WY | N/A | $187 | $108 |
Average rent prices from March 2020 to June 2020 in coronavirus epicenter states
Returning to the analysis of how the coronavirus crisis affected rental rates in 2020, a look inside rental rate differences from the beginning of the shutdown until now shows economic emergency-related trends. Throughout the crisis, hotspots hopscotched from state to state as curves buckled and flattened.
The states most affected moved from California — the first state to issue a stay-at-home order — to the New York/New Jersey region and onto Florida in the summer. Each state in the analysis shows trends from March to June that spotlight how they were affected by the crisis.
New York, and to a lesser extent New Jersey, was hit hardest at the apex. New York City saw 5 percent of its population pick up and leave the city for safer ground, leaving most residents to fight the pandemic, as well as job losses. Every apartment category increased in price by at least $300 as calls for #cancelrent increased. New Jersey, where many fled to, also saw steady but lower increases.
California was able to get a handle on the crisis early in many places, and actually saw a drop in rent prices for one-bedrooms. But the state was still hit hard with more than 6 million job losses and experienced rises in rent overall. The pandemic hit Florida later in the year, but unemployment from shutdowns still affected rent prices. Studio apartments saw a decrease from March to June, but one-, two- and three-bedroom units all saw rises in rates along with rises in cases.
| Bedroom | State | Average Rent (March 2020) | Average Rent (June 2020) | Average Rent % Change |
|---|---|---|---|---|
| Studio | New York | $2,159 | $2,466 | 14.2% |
| 1 | New York | $2,281 | $2,573 | 12.8% |
| 2 | New York | $2,445 | $2,803 | 14.6% |
| Studio | New Jersey | $1,973 | $1,991 | 0.9% |
| 1 | New Jersey | $1,989 | $2,053 | 3.2% |
| 2 | New Jersey | $2,488 | $2,593 | 4.2% |
| Studio | Florida | $1,736 | $1,631 | -6.0% |
| 1 | Florida | $1,580 | $1,656 | 4.8% |
| 2 | Florida | $1,780 | $1,882 | 5.7% |
| Studio | California | $2,423 | $2,463 | 1.7% |
| 1 | California | $2,599 | $2,577 | -0.8% |
| 2 | California | $3,197 | $3,217 | 0.6% |
Average rent prices from March 2020 to June 2020 in coronavirus epicenter cities
There were a number of cities at the epicenter of the crisis since March, coming in waves over the last four months. Seattle was the first to be affected, followed closely by Los Angeles. New York became the nation’s ground zero at the spring peak, with hotspots flaring up in cities like Detroit and New Orleans. Come to the start of summer, Miami, Houston and Phoenix spiked cases.
But when you drill down in the data to the city level in these hotspots, the changes in rental rates from the start of the shutdown in March to the end of the second quarter in June don’t show much pandemic-related fluctuation. In New York, while one-bedroom apartments shot up nearly $300, studios and two bedrooms actually decreased. Studios and one-bedrooms in L.A. dropped, as did most lease prices in Miami, Houston and Detroit. New Orleans and Phoenix did see increases across the board, but they were not much higher than in a typical year.
This data seems to show that at the city level, local governments were able to minimize impacts on rental prices and job market losses, including moratoriums on evictions and — very importantly — rent price freezes which stymied increases. It remains to be seen if these trends continue as more rent deferments come due.
| Bedroom | City | Average Rent (March 2020) | Average Rent (June 2020) | Average Rent % Change |
|---|---|---|---|---|
| Studio | New York, NY | $3,389 | $3,358 | -0.9% |
| 1 | New York, NY | $4,287 | $4,585 | 7.0% |
| 2 | New York, NY | $5,749 | $5,626 | -2.1% |
| Studio | Miami, FL | $1,848 | $1,809 | -2.1% |
| 1 | Miami, FL | $2,501 | $2,373 | -5.1% |
| 2 | Miami, FL | $2,930 | $2,886 | -1.5% |
| Studio | Los Angeles, CA | $2,359 | $2,380 | 0.9% |
| 1 | Los Angeles, CA | $3,151 | $3,090 | -1.9% |
| 2 | Los Angeles, CA | $4,379 | $4,550 | 3.9% |
| Studio | Houston, TX | $1,186 | $1,200 | 1.2% |
| 1 | Houston, TX | $1,223 | $1,221 | -0.2% |
| 2 | Houston, TX | $1,590 | $1,551 | -2.5% |
| Studio | Seattle, WA | $1,729 | $1,751 | 1.3% |
| 1 | Seattle, WA | $2,557 | $2,475 | -3.2% |
| 2 | Seattle, WA | $3,924 | $4,032 | 2.8% |
| Studio | New Orleans, LA | $1,172 | $1,194 | 1.9% |
| 1 | New Orleans, LA | $1,514 | $1,587 | 4.8% |
| 2 | New Orleans, LA | $2,170 | $2,187 | 0.8% |
| Studio | Detroit, MI | N/A | N/A | N/A |
| 1 | Detroit, MI | $1,272 | $1,575 | 23.8% |
| 2 | Detroit, MI | $1,676 | $1,676 | 0.0% |
| Studio | Phoenix, AZ | $1,089 | $1,131 | 3.9% |
| 1 | Phoenix, AZ | $1,407 | $1,458 | 3.6% |
| 2 | Phoenix, AZ | $1,735 | $1,906 | 9.9% |
Methodology
To determine our average rent prices for Q2, we took data from Apartment Guide and Rent.’s multifamily rental property inventory from April, May and June in each given year and averaged those prices together to find an average for the quarter. Month-to-month averages are based on the average price for that respective month. We used a weighted average formula that more accurately represents price availability for each individual unit type and reduces the influence of seasonality on rent prices in specific markets.
Population by cities and states are determined by 2019 U.S. Census Bureau population estimates.
The rent information included in this article is based on multifamily rental property inventory on Apartment Guide and Rent. and is used for illustrative purposes only. The data contained herein do not constitute financial advice or a pricing guarantee for any apartment.


